
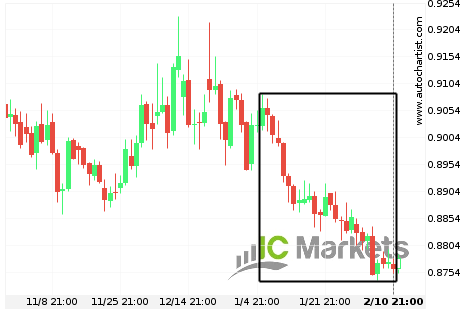
El EURGBP experimentó un movimiento excepcional
Para aquellos de ustedes que no creen en las tendencias, esta puede ser una oportunidad para aprovechar un excepcional movimiento de un 3,31% de EURGBP. Este movimiento está ocurriendo desde hace 37 días. Por otro lado, para aquellos que siguen las tendencias, deben considerar aprovecharse de esta.

EURGBP กำลังเคลื่อนตัวมาก
สำหรับผู้ที่ไม่เชื่อในแนวโน้ม นี่อาจเป็นโอกาสในการใช้ประโยชน์จากการเคลื่อนตัว 3.31% ของ EURGBP การเคลื่อนตัวได้เกิดขึ้นในช่วง 37 วัน ที่ผ่านมา สำหรับผู้ที่กำลังติดตามแนวโน้มอยู่ คุณอาจคิดว่าจะเข้าร่วมในแนวโน้มนี้

คาดว่าจะมีการเคลื่อนตัวครั้งใหญ่สำหรับ GOLD
GOLD ได้เบรคผ่านเส้น 1828.9500 และบอกถึงความเป็นไปได้ของการเคลื่อนตัวไปยัง 1797.9355 ภายในช่วง 3 วันต่อจากนี้ ราคาได้เคยทดสอบที่เส้นนี้แล้วหลายครั้งในอดีต ดังนั้นเทรดเดอร์ควรรอสัญญาณยืนยันของการเบรคนี้ก่อนทำการเทรด ถ้าหากการเบรคไม่ได้รับการยืนยัน เราอาจเห็นการย่อตัวกลับมาที่เส้นตามที่เห็นในช่วง 15 วันที่ผ่านมา
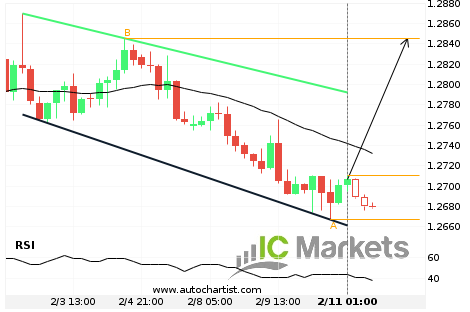
USDCAD – getting close to resistance of a Channel Down
USDCAD is moving towards the resistance line of a Channel Down. Because we have seen it retrace from this line before, we could see either a break through this line, or a rebound back to current levels. It has touched this line numerous times in the last 9 days and may test it again within […]

USDCAD – กำลังเข้าใกล้แนวต้านของ ช่องแบบลง
USDCAD กำลังเคลื่อนที่ไปยังเส้นแนวต้านของ ช่องแบบลง เนื่องจากเราเคยเห็นราคาพักตัวจากเส้นนี้มาก่อน เราอาจได้เห็นการเบรคผ่านเส้นนี้หรือรีบาวน์กลับไปยังระดับปัจจุบัน ราคาได้มาแตะที่เส้นนี้แล้วหลายครั้งในช่วง9 วัน and may test it again within the next 2 วันที่ผ่านมา

เราควรคาดหวังว่าจะมีการเบรคหรือรีบาวน์สำหรับ US Tech 100 Index หรือไม่?
การเคลื่อนตัวของ US Tech 100 Index ไปยังเส้นแนวต้านของ ช่องแบบขึ้น เป็นการทดสอบเส้นที่ราคาเคยได้ไปถึงหลายครั้งแล้วในอดีต เราคาดว่าการทดสอบเส้นนี้จะเกิดขึ้นอีกครั้งใน 2 วัน ต่อไป แต่ยังไม่แน่ใจว่าราคาจะเกิดการเบรคผ่านเส้นนี้ไปได้หรือเพียงแค่เกิดการรีบาวน์กลับไปยังระดับปัจจุบัน
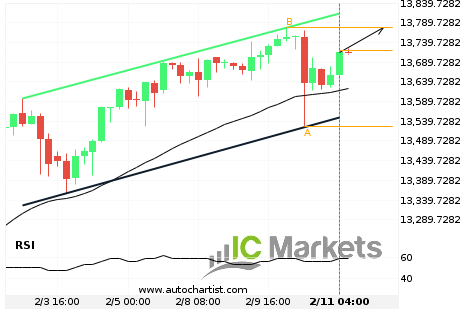
Should we expect a breakout or a rebound on US Tech 100 Index?
The movement of US Tech 100 Index towards the resistance line of a Channel Up is yet another test of the line it reached numerous times in the past. We expect this line test to happen in the next 2 days, but it is uncertain whether it will result in a breakout through this line, […]
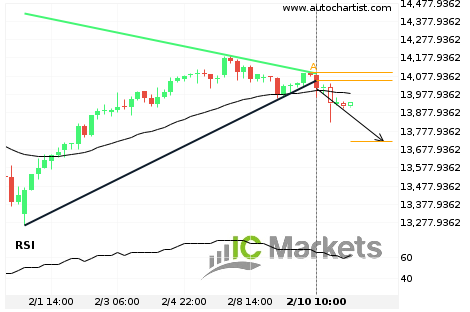
El comienzo de una tendencia bajista para el Germany 30 Index
El Germany 30 Index ha atravesado una línea de soporte de un patrón de gráfico que corresponde a un Triángulo. Si esta irrupción se mantiene, esperamos que el precio del Germany 30 Index pruebe el nivel de 13719.6175 dentro de las próximas 2 días. Pero no se apresure si desea operar, porque ya ha probado […]
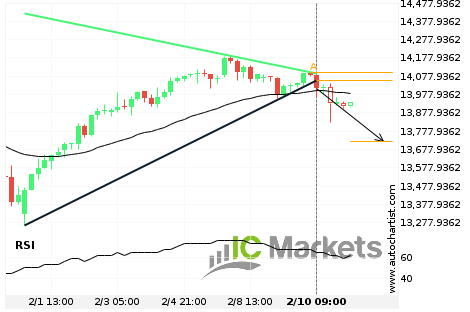
ช่วงเริ่มต้นของแนวโน้ม bearish สำหรับ Germany 30 Index
Germany 30 Index ได้ทะลุผ่าน แนวรับ ของรูปแบบกราฟ สามเหลี่ยม ถ้าหากการเบรคนี้เป็นจริง เราคาดว่าจะเห็นราคาของ Germany 30 Index ไปทดสอบที่ 13719.6175 ภายในช่วง 2 วันถัดไป แต่อย่าพึ่งรีบเทรดจนเกินไป ราคาเคยได้มาทดสอบที่เส้นนี้แล้วในอดีต ดังนั้นคุณควรยืนยันการเบรคก่อนทำการเทรด

ใกล้จะเกิดการทะลุผ่านเส้นราคาสำคัญของ AUDJPY
AUDJPY กำลังเคลื่อนตัวไปยังเส้นของ 81.1195 ซึ่งได้มีการทดสอบมาแล้วหลายครั้งในอดีต เราเคยเห็นว่าราคาได้ย่อตัวจากตำแหน่งนี้มาก่อนในอดีต ดังนั้นในขั้นนี้มันยังไม่ชัดเจนว่าราคาจะสามารถทะลุผ่านราคานี้หรือเกิดการรีบาวน์เหมือนก่อนหน้านี้ ถ้าหาก AUDJPY ดำเนินต่อไปในทิศทางปัจจุบัน เราสามารถคาดหวังได้ว่าราคาจะเข้าไปที่ 81.1195 ภายใน 12 ชั่วโมงถัดไป